UWB RTLS Case Study: Forklift & Industrial Vehicle Collision Avoidance in a High-Throughput Distribution Cente
Real-time forklift–pedestrian proximity alerts and zone enforcement reduced near-miss events while keeping throughput stable during peak shifts.
Key Stats
KPIs (Before vs After)
| Metric | Before | After |
|---|---|---|
| Forklift–pedestrian near-miss events (reported) | 18 per month | 7 per month |
| Speed-zone violations | 110 per week | 28 per week |
| Average time to confirm & respond to a safety call | 6 minutes | 2 minutes |
| Dock-to-stock” cycle time during peak shifts | 2.8 hours | |
| “Dock-to-stock” cycle time during peak shifts | 2.3 hours |
Overview
A high-throughput fulfillment center running 24/7 needed a way to reduce forklift–pedestrian near misses without slowing down operations. GridRTLS deployed a UWB RTLS safety layer that combines precise location awareness with forklift-side collision avoidance hardware. The result was fewer uncontrolled intersections, measurable compliance with speed zones, and a repeatable workflow to investigate safety events using trajectory replay and video linkage.
Customer Background
The customer operates a regional e-commerce fulfillment and cross-dock hub that processes a fast-changing mix of pallets, cartons, and high-value goods. The site combines inbound receiving, put-away, replenishment, picking, packing, and outbound staging in one connected footprint. During peak season, temporary staffing increases sharply and daily layout changes are common—creating moving safety risks that traditional signage and training struggle to keep up with.
Key operational traits:
-
Multi-shift operation with frequent forklift traffic spikes during inbound/outbound waves
-
Narrow aisles and shared intersections where pedestrians must cross vehicle routes
-
Layout changes driven by seasonal SKU profiles and temporary overflow zones
-
Existing CCTV coverage, but no automated “where + when” correlation to safety events
Challenges
-
Blind intersections and mixed-traffic pinch points
Even with mirrors and painted walkways, the facility had repeated “near collision” areas where sight lines were blocked by racks, staged pallets, or dock activity. -
Enforcing speed zones without objective proof
Supervisors could remind drivers about limits, but there was no consistent, measurable way to identify repeat offenders or validate improvements by zone and shift. -
No closed-loop workflow for safety events
Incidents and near misses were reported informally. Investigation depended on memory and manual CCTV searching, which slowed corrective actions and made “root cause” discussions subjective. -
Operational continuity requirements
Any safety upgrade had to avoid long downtime and must remain stable through frequent layout changes.
Solution
GridRTLS delivered a two-layer approach:
Layer 1 — Precise indoor awareness (UWB RTLS)
A UWB anchor network provides facility-wide location awareness for forklifts and pedestrians, enabling:
-
Real-time map view of people and vehicles
-
Zone rules (speed zones, restricted pedestrian crossings, “no-entry” aisles)
-
Incident reconstruction using trajectory replay
-
Shift-based analytics to identify recurring risk patterns
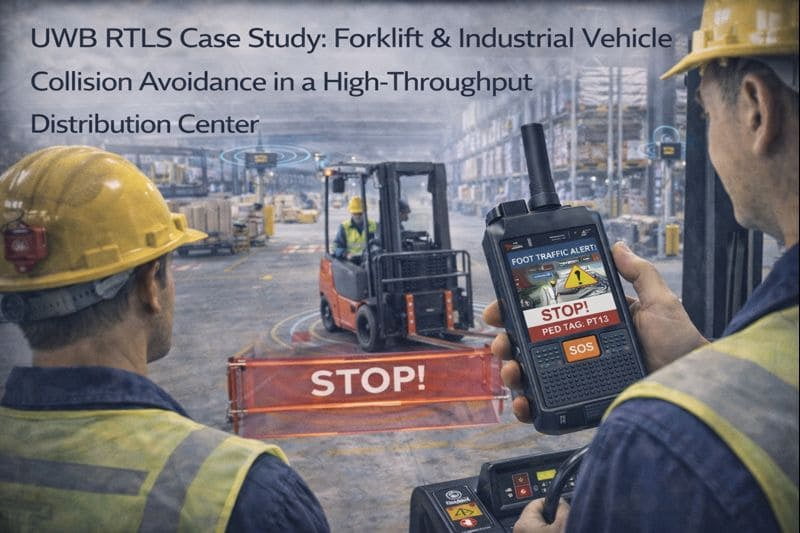
Layer 2 — Forklift-side collision avoidance (actionable alerts)
Forklifts were equipped with collision-avoidance hardware to generate immediate warnings in the cab and trigger external alarms:
-
Multi-level proximity thresholds (awareness → warning → critical)
-
Audible + visual alerts for both driver and nearby pedestrians
-
Optional relay outputs for stack lights / buzzers / speed limit interlocks
-
Event logs synchronized back to the platform for statistics and training
Implementation
1) Risk mapping & zoning workshop
The project began with a joint workshop to map:
-
The top 12 high-risk intersections and blind corners
-
Pedestrian crossings and pick-module entry points
-
High-speed travel lanes vs. precision maneuver zones (docks, packing, staging)
-
Shift patterns (where and when risk spikes happen)
2) Anchor placement strategy (designed for change)
Anchors were installed to create dense coverage at intersections and “thin coverage” in low-risk travel lanes. This made the system tolerant of layout changes while keeping precision where it matters most. The final design used 44 anchors covering ~42,000 m², with reinforced coverage in:
-
Inbound receiving + dock apron
-
Replenishment cross-aisles
-
Packing + outbound staging intersections
-
Battery charging + maintenance bay (often overlooked risk area)
3) Wearables & vehicle devices
-
Pedestrians: issued wearables (helmet / badge form factor) assigned by role and shift
-
Forklifts: equipped with collision-avoidance hardware + vehicle identity tag for platform correlation
-
Supervisors: dashboard access for live monitoring, event acknowledgement, and investigation
4) Alert logic tuned to real operations
Instead of one global distance threshold, the facility used scenario-based rules:
-
Intersection mode: tighter thresholds at blind corners
-
Dock mode: focus on reversing events and congestion
-
Picking aisle mode: low-speed zone + pedestrian priority
-
Charging bay mode: “no-go” pedestrian restriction during certain operations windows
5) Closed-loop incident workflow
The system was configured so that when an alarm occurs:
-
The event location is pinned on the map
-
The nearest relevant camera view is called up (if available)
-
The supervisor acknowledges the event
-
The safety team reviews the trajectory and zone context
-
The corrective action is logged (training / signage / layout change / policy)
Results
Within the first 8–12 weeks after go-live, the customer achieved measurable improvements:
-
Near-miss events (reported) dropped from 18/month to 7/month by applying intersection-specific controls and forklift-side alerts.
-
Speed-zone violations decreased from 110/week to 28/week, with the biggest gains occurring in replenishment cross-aisles and outbound staging routes.
-
Average response time to confirm and act on a safety call improved from 6 minutes to 2 minutes, because event location and context were immediately visible.
-
Dock-to-stock time improved from 2.8 hours to 2.3 hours during peak shifts, as fewer uncontrolled congestion events and fewer “stop-and-reset” disruptions occurred.
Just as importantly, the project created a repeatable “safety improvement loop”:
-
identify risk hotspots → implement zone rules → verify behavior change using data → standardize or adjust.
Quote
“Before, we only heard about close calls after the shift—and we couldn’t always prove what happened. Now we can see where the risk concentrates, replay the event, and fix the root cause without slowing down the whole operation.”<br />
— Safety & Operations Supervisor (Anonymized)
Related Solutions
Related Products
Want a similar deployment?
Share your site type, tag count, coverage area, and safety requirements. We’ll recommend a UWB / GNSS design and a rollout plan.